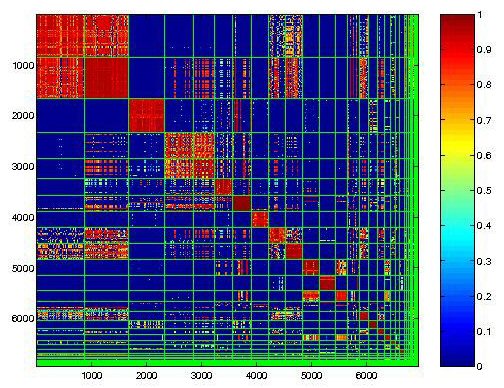
What a Similarity Matrix shows, is two different points and values. The data is laid out across the map and like many graphs like this one have the x and y axis labeled with the variables, or values. The matrix will then take the values from the two axis and graph them determined by their score. They are often done in colors like some other graphs to show the trends in the values.
No comments:
Post a Comment